IEEE Visualization 2004 Contest Entry
PDF: Link to PDF Document
Video: Link to Video
Visualization Fusion: Hurricane Isabel Dataset
Authors
- Ming Jiang, The Ohio State University, jiang@cse.ohio-state.edu
- Naeem Shareef, The Ohio State University, shareef@cse.ohio-state.edu
- Caixia Zhang, The Ohio State University, zhangc@cse.ohio-state.edu
- Roger Crawfis, The Ohio State University, crawfis@cse.ohio-state.edu
- Raghu Machiraju, The Ohio State University, raghu@cse.ohio-state.edu
- Han-Wei Shen, The Ohio State University, hwshen@cse.ohio-state.edu
Contest Entry Visualization System
Our main goal in developing visualization techniques for the Hurricane Isabel dataset is to engender better understanding of the underlying physical phenomenon. Our primary contribution is adapting a set of existing algorithms and devising an overall framework for applying them to the dataset. In particular, we applied several vortex detection algorithms to the time varying dataset in order to automatically identify the various parts of the hurricane. We then developed a framework to track the position of the hurricane across time, while computing both its translational velocity and maximum wind speed. Finally, we experimented with several volume rendering techniques to better understand some of the physical properties of the dataset.
Criterion 1: Interactivity
In order to handle large-scale time-varying datasets, interactivity would be a nice feature to have; however, that's not the only viable option. In fact, automatic processing, where there is little or no user interaction required, is also a desired feature. The bottom line is that the user wants to expend as little time as possible handling the dataset, whether it's through fast interaction or no interaction.
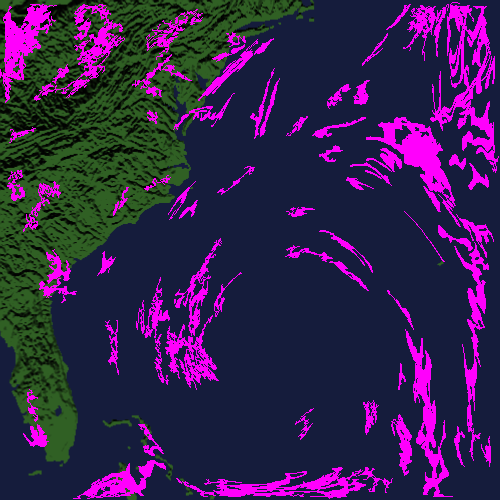
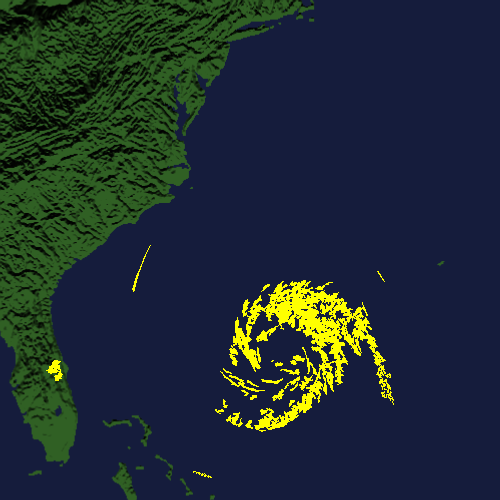
Toward this end, we experimented with several existing vortex detection algorithms in order to automatically identify the various structures of the hurricane, starting from the central region. We applied four popular vortex detection algorithms to the dataset: combinatorial method (white), normalized helicity (magenta), lambda2 method (yellow), and swirl parameter (cyan). However, none of them worked properly for this dataset. One of the main reasons for this is because the eye of the hurricane -- the vortex core -- does not exhibit any kind of swirling motion.

Criterion 2: Exploratory Support
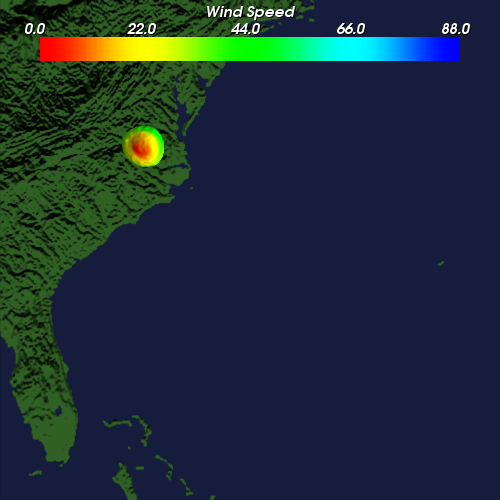
To overcome the aforementioned problem, we developed a framework to automatically identify the central region of the hurricane. It utilizes a technique that detects vortices as regions of low pressure. In order to automate this process for all time steps, we introduced a local minimum velocity magnitude criterion. Thus the eye of the hurricane lies within a region of low pressure with a local minimum velocity magnitude.
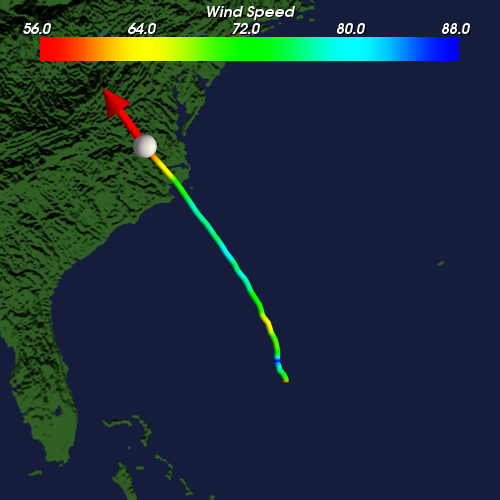
The left figure below shows the results from applying this framework to the dataset at time step 48. An isosurface is extracted for the low pressure; the surface is colored using the velocity magnitude. What's unique about this framework is that it can correctly identify the central region of the hurricane without introducing any artifacts. The right figure below shows the results from performing hurricane tracking after automatically identifying the central region of the hurricane for all time steps. Iconic visualization is used to illustrate the path of the hurricane, the eye of the hurricane at each time step (the spheres), the translational velocity (the arrows), and the maximum wind speed (the colors).
Criterion 3: Multiple Characteristics
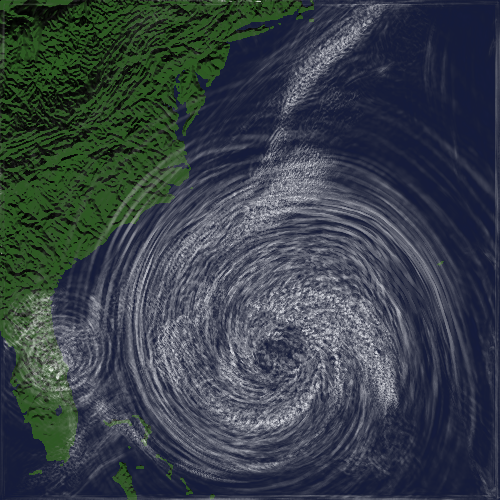
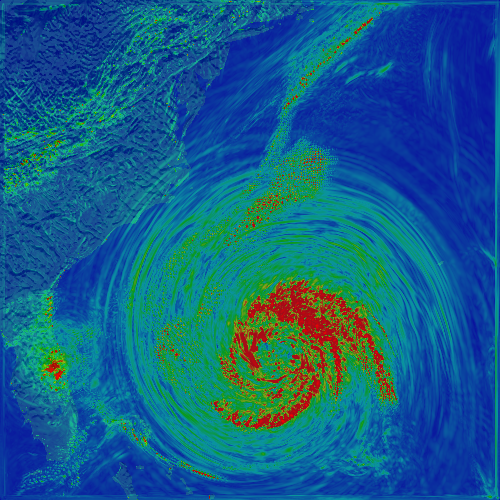
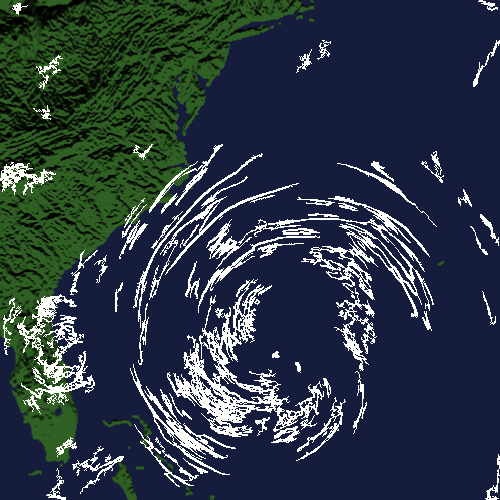
We use volume rendering as a tool to visualize and explore three key components used in most vortex detection algorithms: velocity magnitude, vorticity magnitude, and complex eigenvalues. Emission only rendering shows the accumulation of attribute values in the viewing direction to give overall structural information about the scalar field. Maximum Projection can show hot spots where maximum values occur.
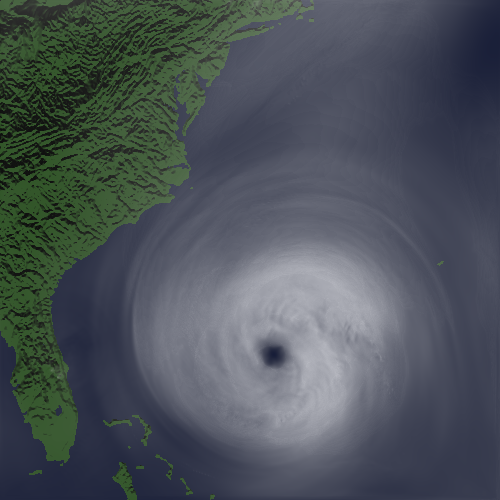
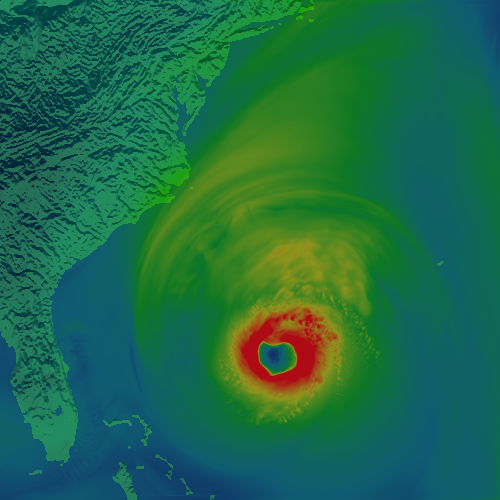
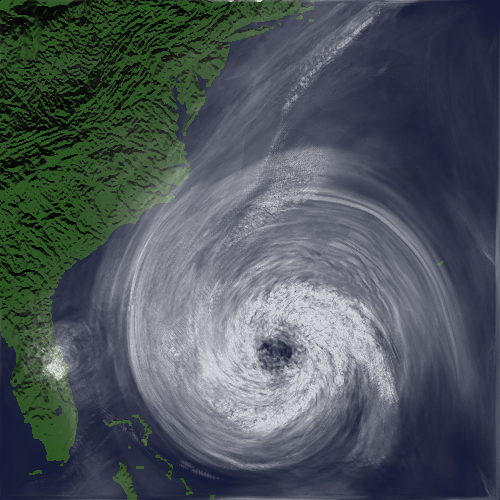
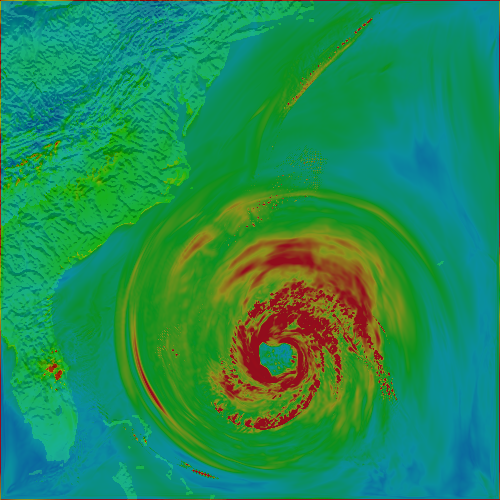
The figures below show the results from applying the emission only and maximum projection to time step 8 of the dataset. The top figure shows the results for the velocity magnitude. The hotspots correspond to regions where there is high wind speed. The middle figure shows the results for the vorticity magnitude. The hotspots correspond to regions where there are large amounts of local rotation -- this can be useful for interpreting where the hurricane is likely to be most destructive. To reinforce this notion, the bottom figure shows the results for the complex eigenvalues of the velocity gradient tensor. The emission only image shows two sets of spirals: the larger one surrounding the hurricane eye, and the smaller one surrounding the hotspots arising on top of Florida.