IEEE Visualization 2004 Contest Entry
PDF: PDF Document
Video: Quicktime(6.6 MB)
Investigating Hurricane Isabel using Texture Advection
Authors
- Tobias Schafhitzel (student), University of Stuttgart, schafhts@vismail.informatik.uni-stuttgart.de
- Daniel Weiskopf, University of Stuttgart, weiskopf@vis.informatik.uni-stuttgart.de
- Thomas Ertl, University of Stuttgart, ertl@vis.informatik.uni-stuttgart.de
Contest Entry Visualization System
Our visualization system is an interactive, timedependent, 3D multi-field representation which allows the user to investigate a combined visualization of scalar field and vector field information. The system was developed in summer 2004 in the context of the diploma thesis of Tobias Schafhitzel advised by Daniel Weiskopf and Thomas Ertl.
Criterion 1: Interactivity
Ā
Performance measurements for a Windows XP machine with an ATI Radeon X800 GPU (256 MB). The sizes of the vectorfield are stated in the first column. The generated image size is 600x600 pixels, the internal color depth for the Advection step 16 bit/channel=64 bit and the color depth for the final display 8 bit/channel=32 bit. A subsampled data of 256 x 256 x 64 maximum is considered.
Texture Advection only
|
Resolution |
FPS |
|
64 x 64 x 16 |
341 |
| 128 x 128 x 32 | 137 |
| 256 x 256 x 64 | 34 |
Ā
Scalar Field Visualization
|
Resolution |
FPS |
|
64 x 64 x 16 |
290 |
| 128 x 128 x 32 | 183 |
| 256 x 256 x 64 | 150 |
Ā
Combined Visualization 1 (Texture Advection and Scalar Field Visualization)
|
Resolution |
FPS |
|
64 x 64 x 16 |
249 |
| 128 x 128 x 32 | 110 |
| 256 x 256 x 64 | 32 |
Ā
Combined Visualization 2 (3D Texture Advection, Scalar Field Visualization and 2D Texture Advection)
|
Resolution |
FPS |
|
64 x 64 x 16 |
64 |
| 128 x 128 x 32 | 32 |
| 256 x 256 x 64 | 15 |
Ā
Criterion 2: Exploratory Support
Parameters used to manipulate the visualization:
Texture Advection and Flow visualization:
- unnormalized vector field to distinguish the velocity of the flow On/Off
- normalized vector field to distinguish the direction of the flow On/Off
- transferfunction for 4 materials (RGBA)
- resolution of advected particles
- amount of noise
- blending parameters
- clipping-plane
- additional dye injection + dye options
- Interaction with mouse and keys
Scalar Field Representation:
- transferfunction for scalar values
- 2 x scrollbar to select range of velocity
- 1 x scrollbar to select range of lambda2
- 1 x scrollbar to select range of external scalar values
- 2 x scrollbars for additional blending manipulation
- Texture Advection on selected Isosurfaces On/Off
2D Selection Plane and 2D High-Resolution representation
- Selection Plane as additional Clipping Plane On/Off
- Grid Representation on Selection Plane
- High-Resolution Advection Representation
- Zoom Plane
- Interaction of Selection- and Zoomplane with mouse and keys
- dye
- amount of noise
- resolution of advected particles
- unnormalized vector field to distinguish the velocity of the flow On/Off
- normalized vector field to distinguish the direction of the flow On/Off
Ā
By the use of the scrollbars the user is able to combine the Flow Visualization with any Scalar Representation. For example he selects a range of lambda2 + a range of velocity + a 2D Selection Plane.
Criterion 3: Multiple Characteristics
Visualization Performed 1 - flow
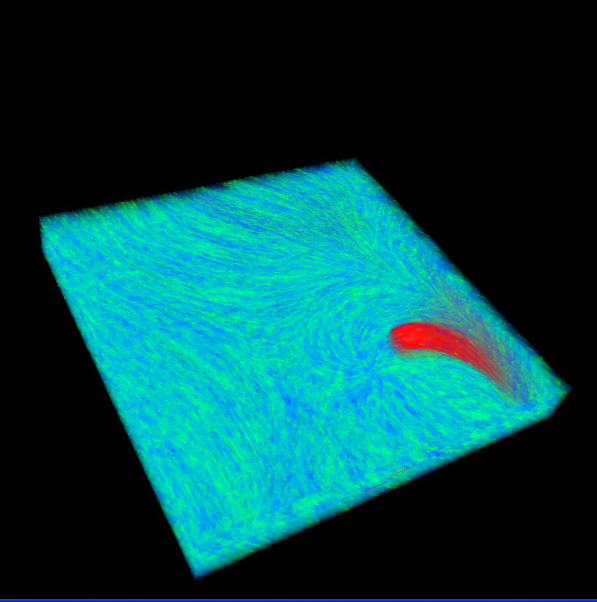
3D Texture Advection + additional red Dye: 2 Materials (blue and green) are advected time-dependently using a normalized vectorfield.
|
|
|
Ā
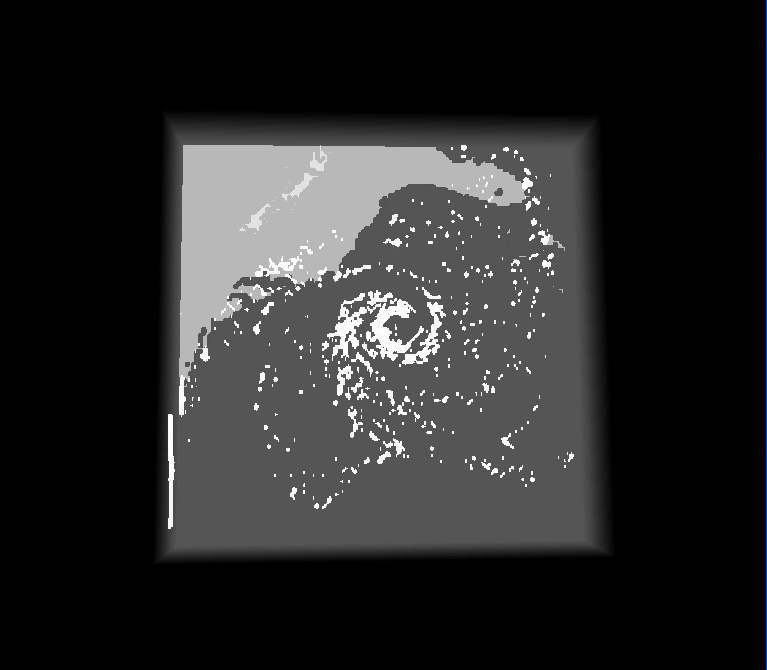
Visualization Performed 2 - scalars: clouds, pressure, temperature
Representing the clouds using a luminance setting of a small range of
the scalar values in the transferfunction.
Also a small range of pressure and temperature was selected and mapped on a
red-green-blue color gradient.
 |
 |
|
|
|
Ā
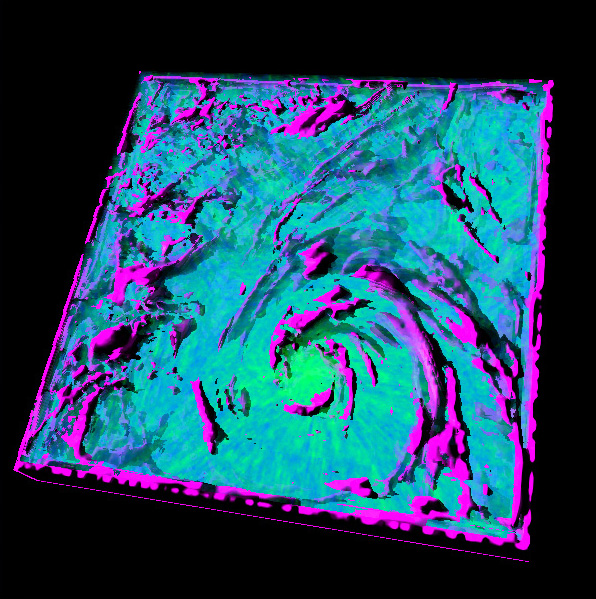
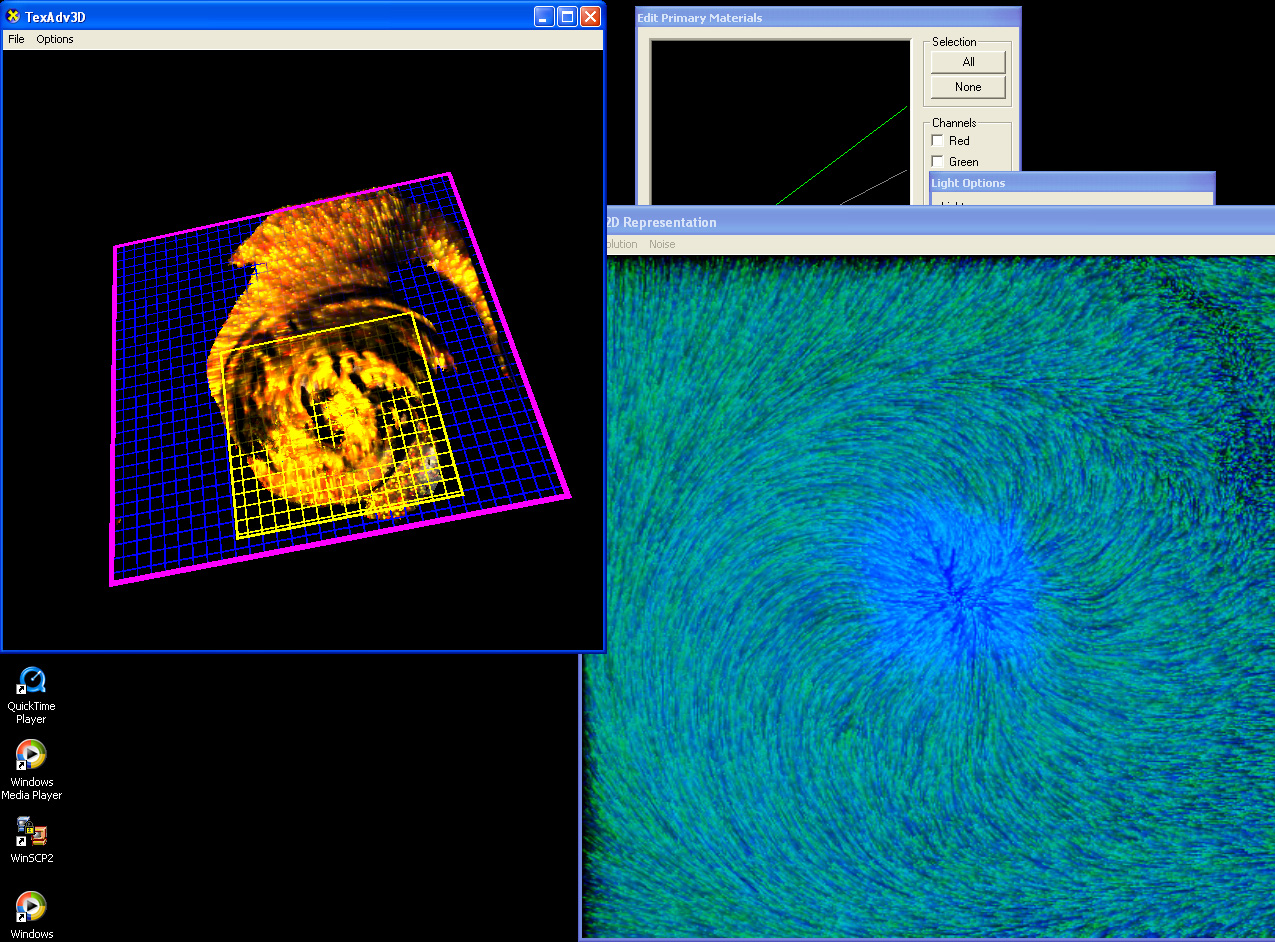
Visualization Performed 3 - lambda2 + flow
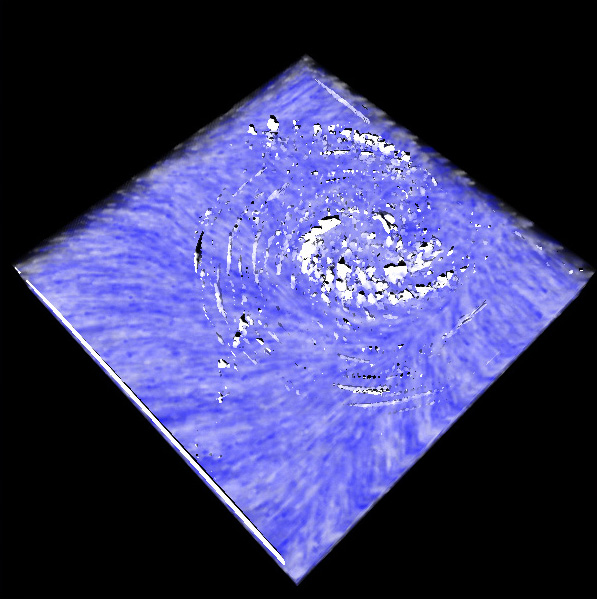
3D Texture Advection + lambda2 scalar values: Here the transparency of the Flow Visualization is very high (Set Alpha in the transferfunction -> 0). A big range of lambda2 is selected and mapped with purple and a high opacity. Figure 3 shows a Flow Visualization with a higher opacity and white colored lambda2 values.
|
|
|
|
Ā
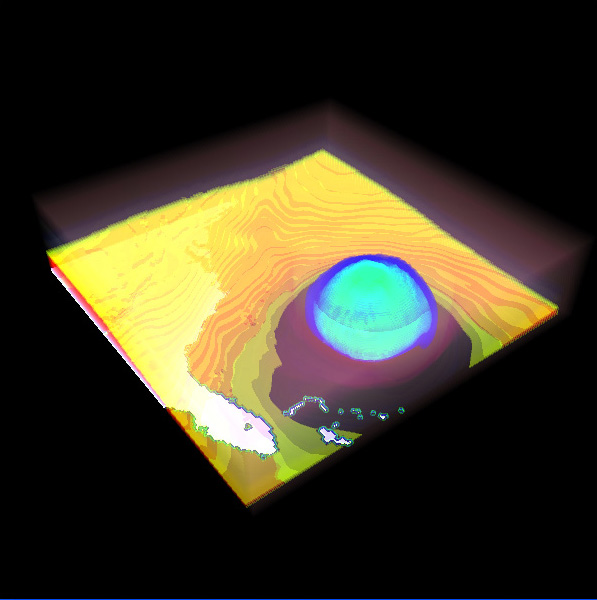
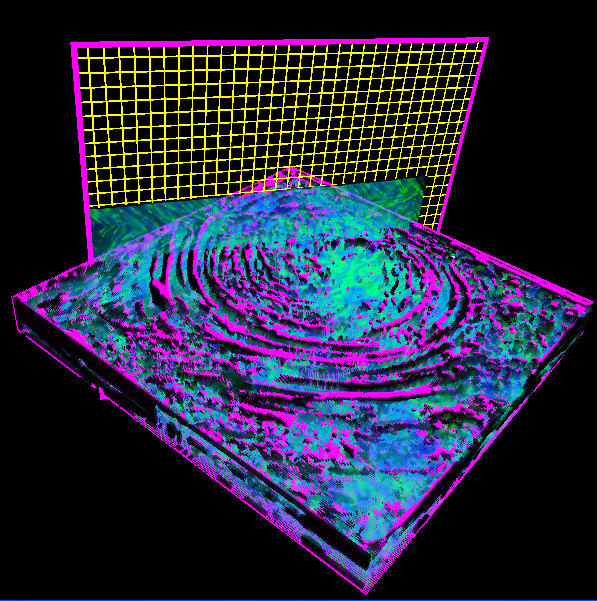
Visualization Performed 4 - 2D Selection- and Zoom-Plane + Scalar Visualization + 3D Texture Advection
An additional 2D Selection Plane is inserted. A High-Resolution Representation of the flow is mapped to the Zoom-Plane, using different transferfuntions for the flow and the scalar values. Also 3D Texture Advection is shown in Figure 1.
|
|
|
|
Ā
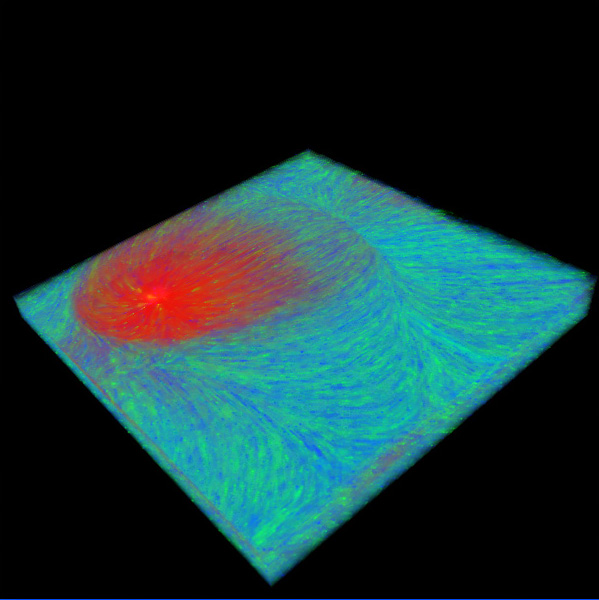
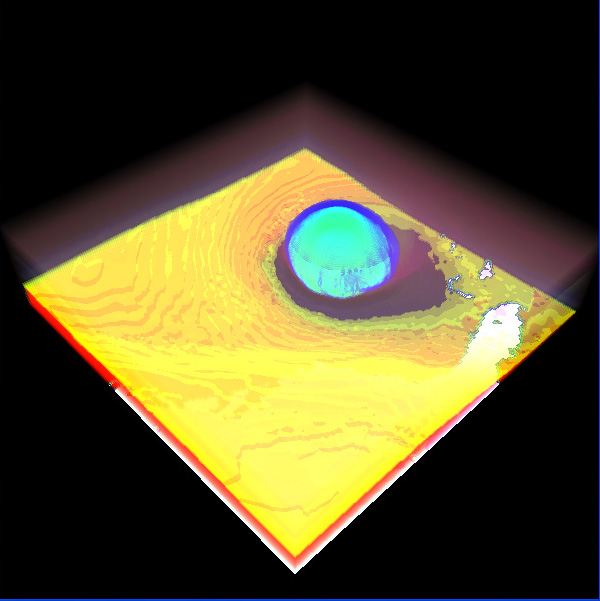
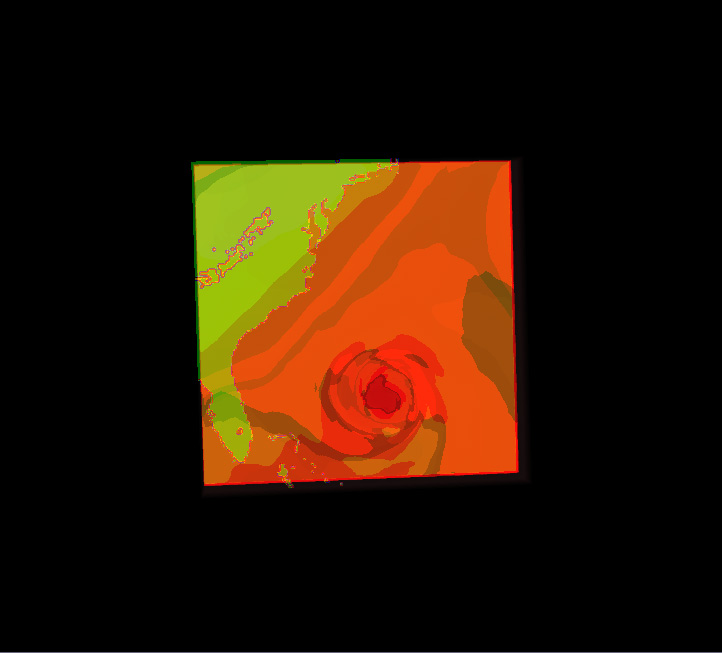
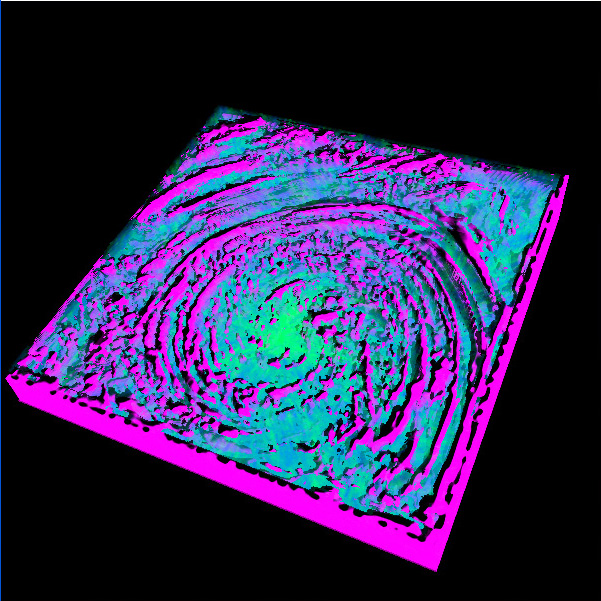
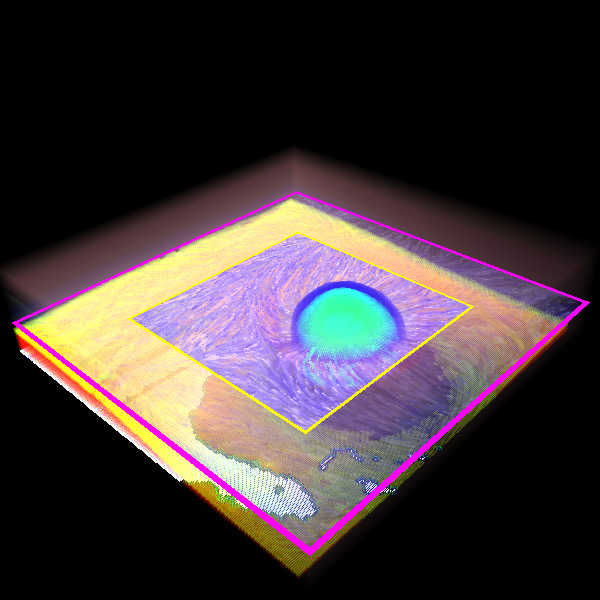
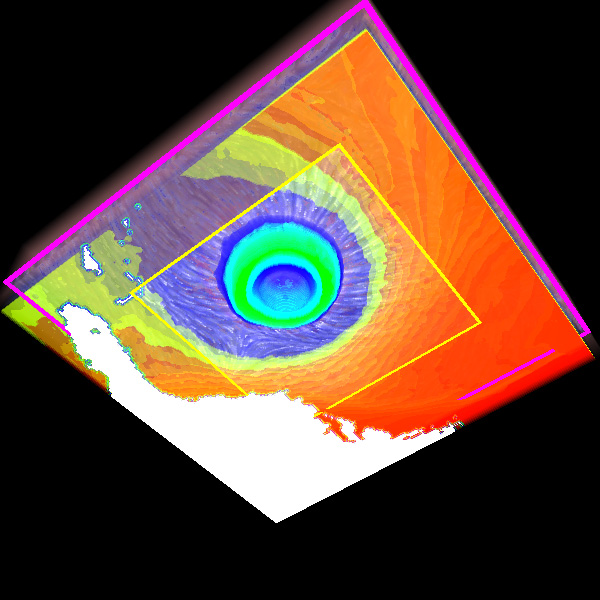
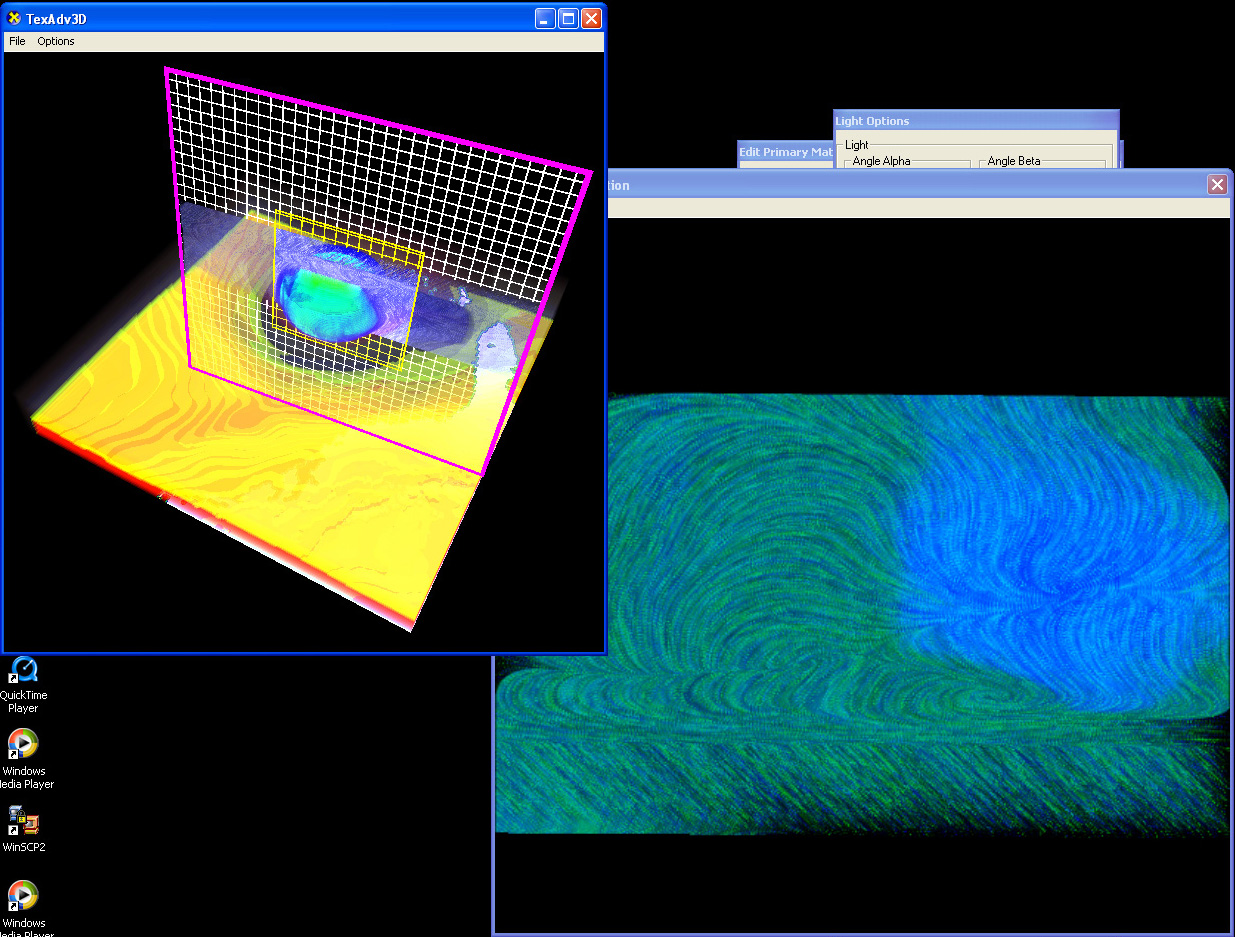
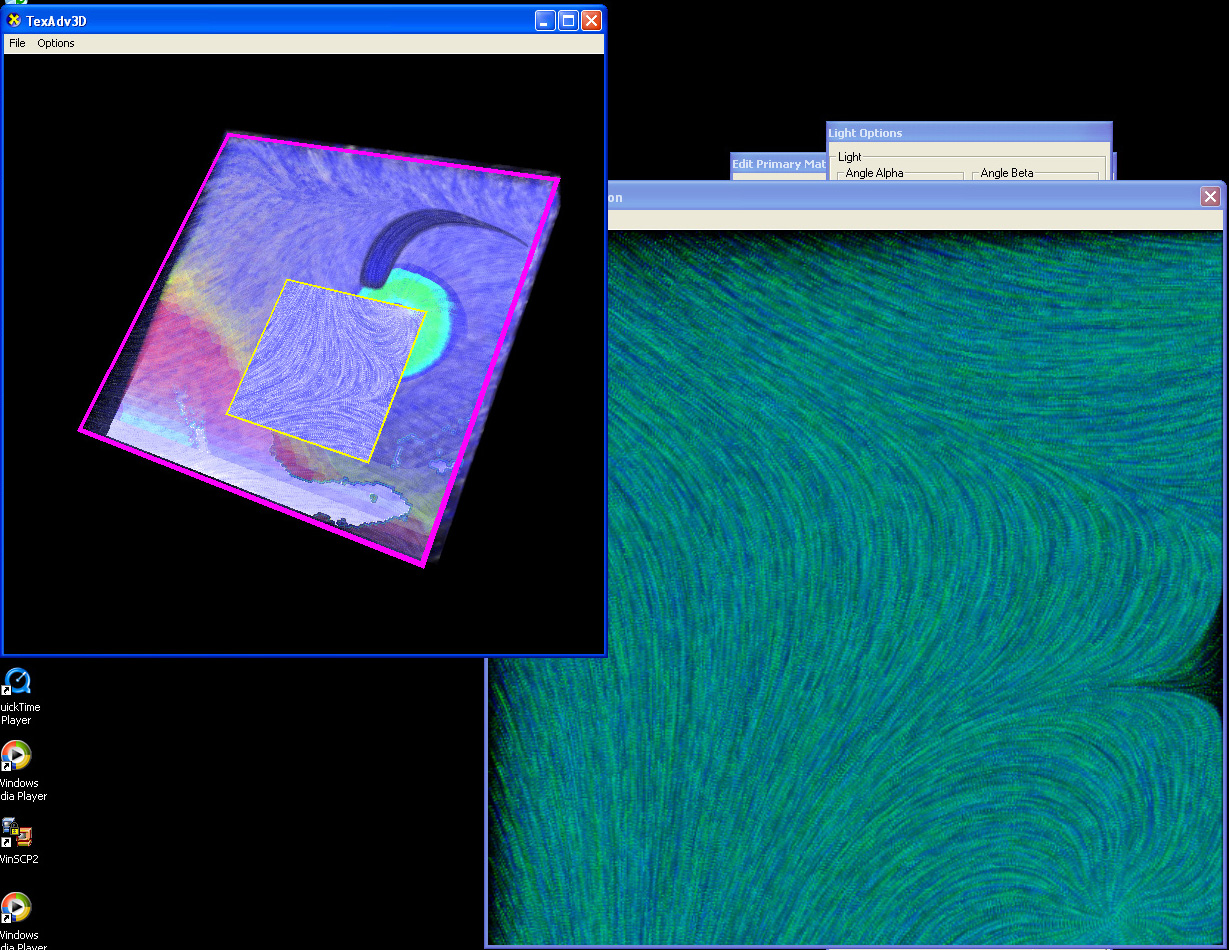
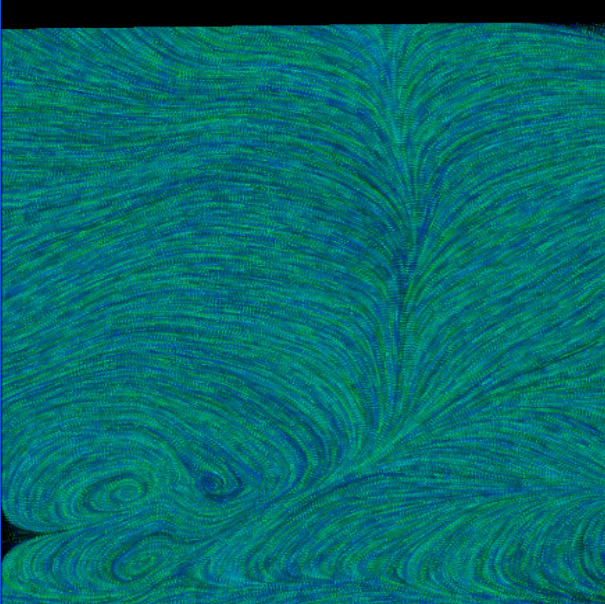
Visualization Performed 5 - 2D Selection- and Zoom-Plane + Scalar Visualization + 3D Texture Advection + 2D Texture Advection
Figure 1 shows a range of pressure mapped on a color gradient + a
blue-white 3D Texture Advection + the Selection Plane with active Zoom Plane.
The 2D Representation (with additional blue dye) shows the center of Isabel,
distinguished by the yellow Zoom Plane. In Figure 2 and 3 the 2D
representation is mapped to the Zoom Plane. Figure 4 shows the High-Resolution
2D representation, here 1024x1024 (using an interpolated vector field).
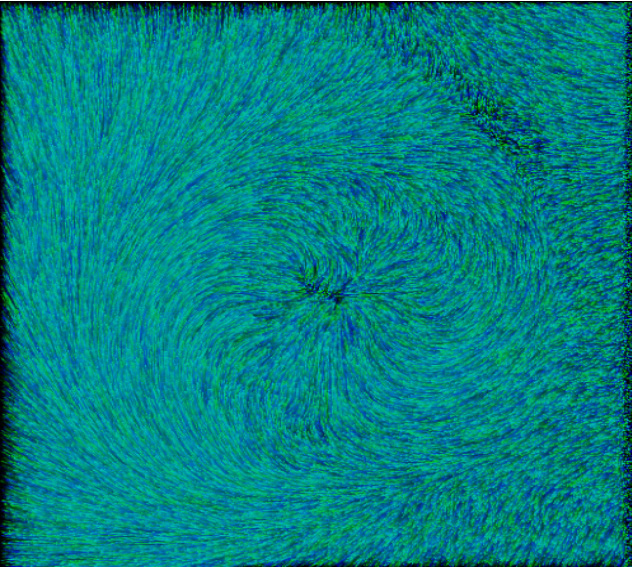
Figure 6 shows the rotation of the hurricane using 2D texture advection with an unnormalized vector field
 |
 |
|
|
|
|
|
|
Ā
Additional Comments
none