| |||

| |||
|
| |||
|
| |||
|
|
Overview
The IEEE 2013 SciVis Contest is an official event of the IEEE VIS 2013 conference, which will be held in Atlanta, GA (October 13 - 18, 2013). This year's contest will target the exciting domain of developmental neuroscience. Specifically, contest participants will help identify spatial and temporal gene expression patterns in the developing mouse brain.
By participating in this contest, you can demonstrate your novel visualization and interaction techniques and simultaneously help to profile genes functionally relevant to brain development or developmental brain disorders.
The Allen Institute for Brain Science has made the Allen Developing Mouse Brain Atlas data set available for use for the contest, but the Institute is not an official sponsor of the contest.
IMPORTANT UPDATE - The data set has changed! See the News section below for details. IMPORTANT UPDATE 2 - The contest deadline has been extended! You now have until September 2 to make your submission. See the Submission section for details. If you are planning to make a submission, please email the contest organizers at the addresses listed in the Contact section.
Data Description
The data set tracks the level of gene expression for ~2000 genes in a 3D mouse brain from embryonic stages through adulthood. These expression levels are recorded within annotated 3D regions that change size and shape (and even divide) during development. The genes are organized into 11 categories.
The ~2000 genes in the Atlas are characterized by in situ hybridization (ISH) across three embryonic and three early postnatal ages. ISH is a technique for labeling cells expressing a particular mRNA sequence. In ISH parlance, a probe is the RNA sequence hybridized to a tissue specimen, but for practical purposes a probe usually only covers a subset of the entire gene sequence. As a result, there can be multiple probes, and therefore multiple image volumes, for a single gene. Brain sections are treated and imaged at high resolution, at which point an automatic cell segmentation algorithm quantifies regional expression.
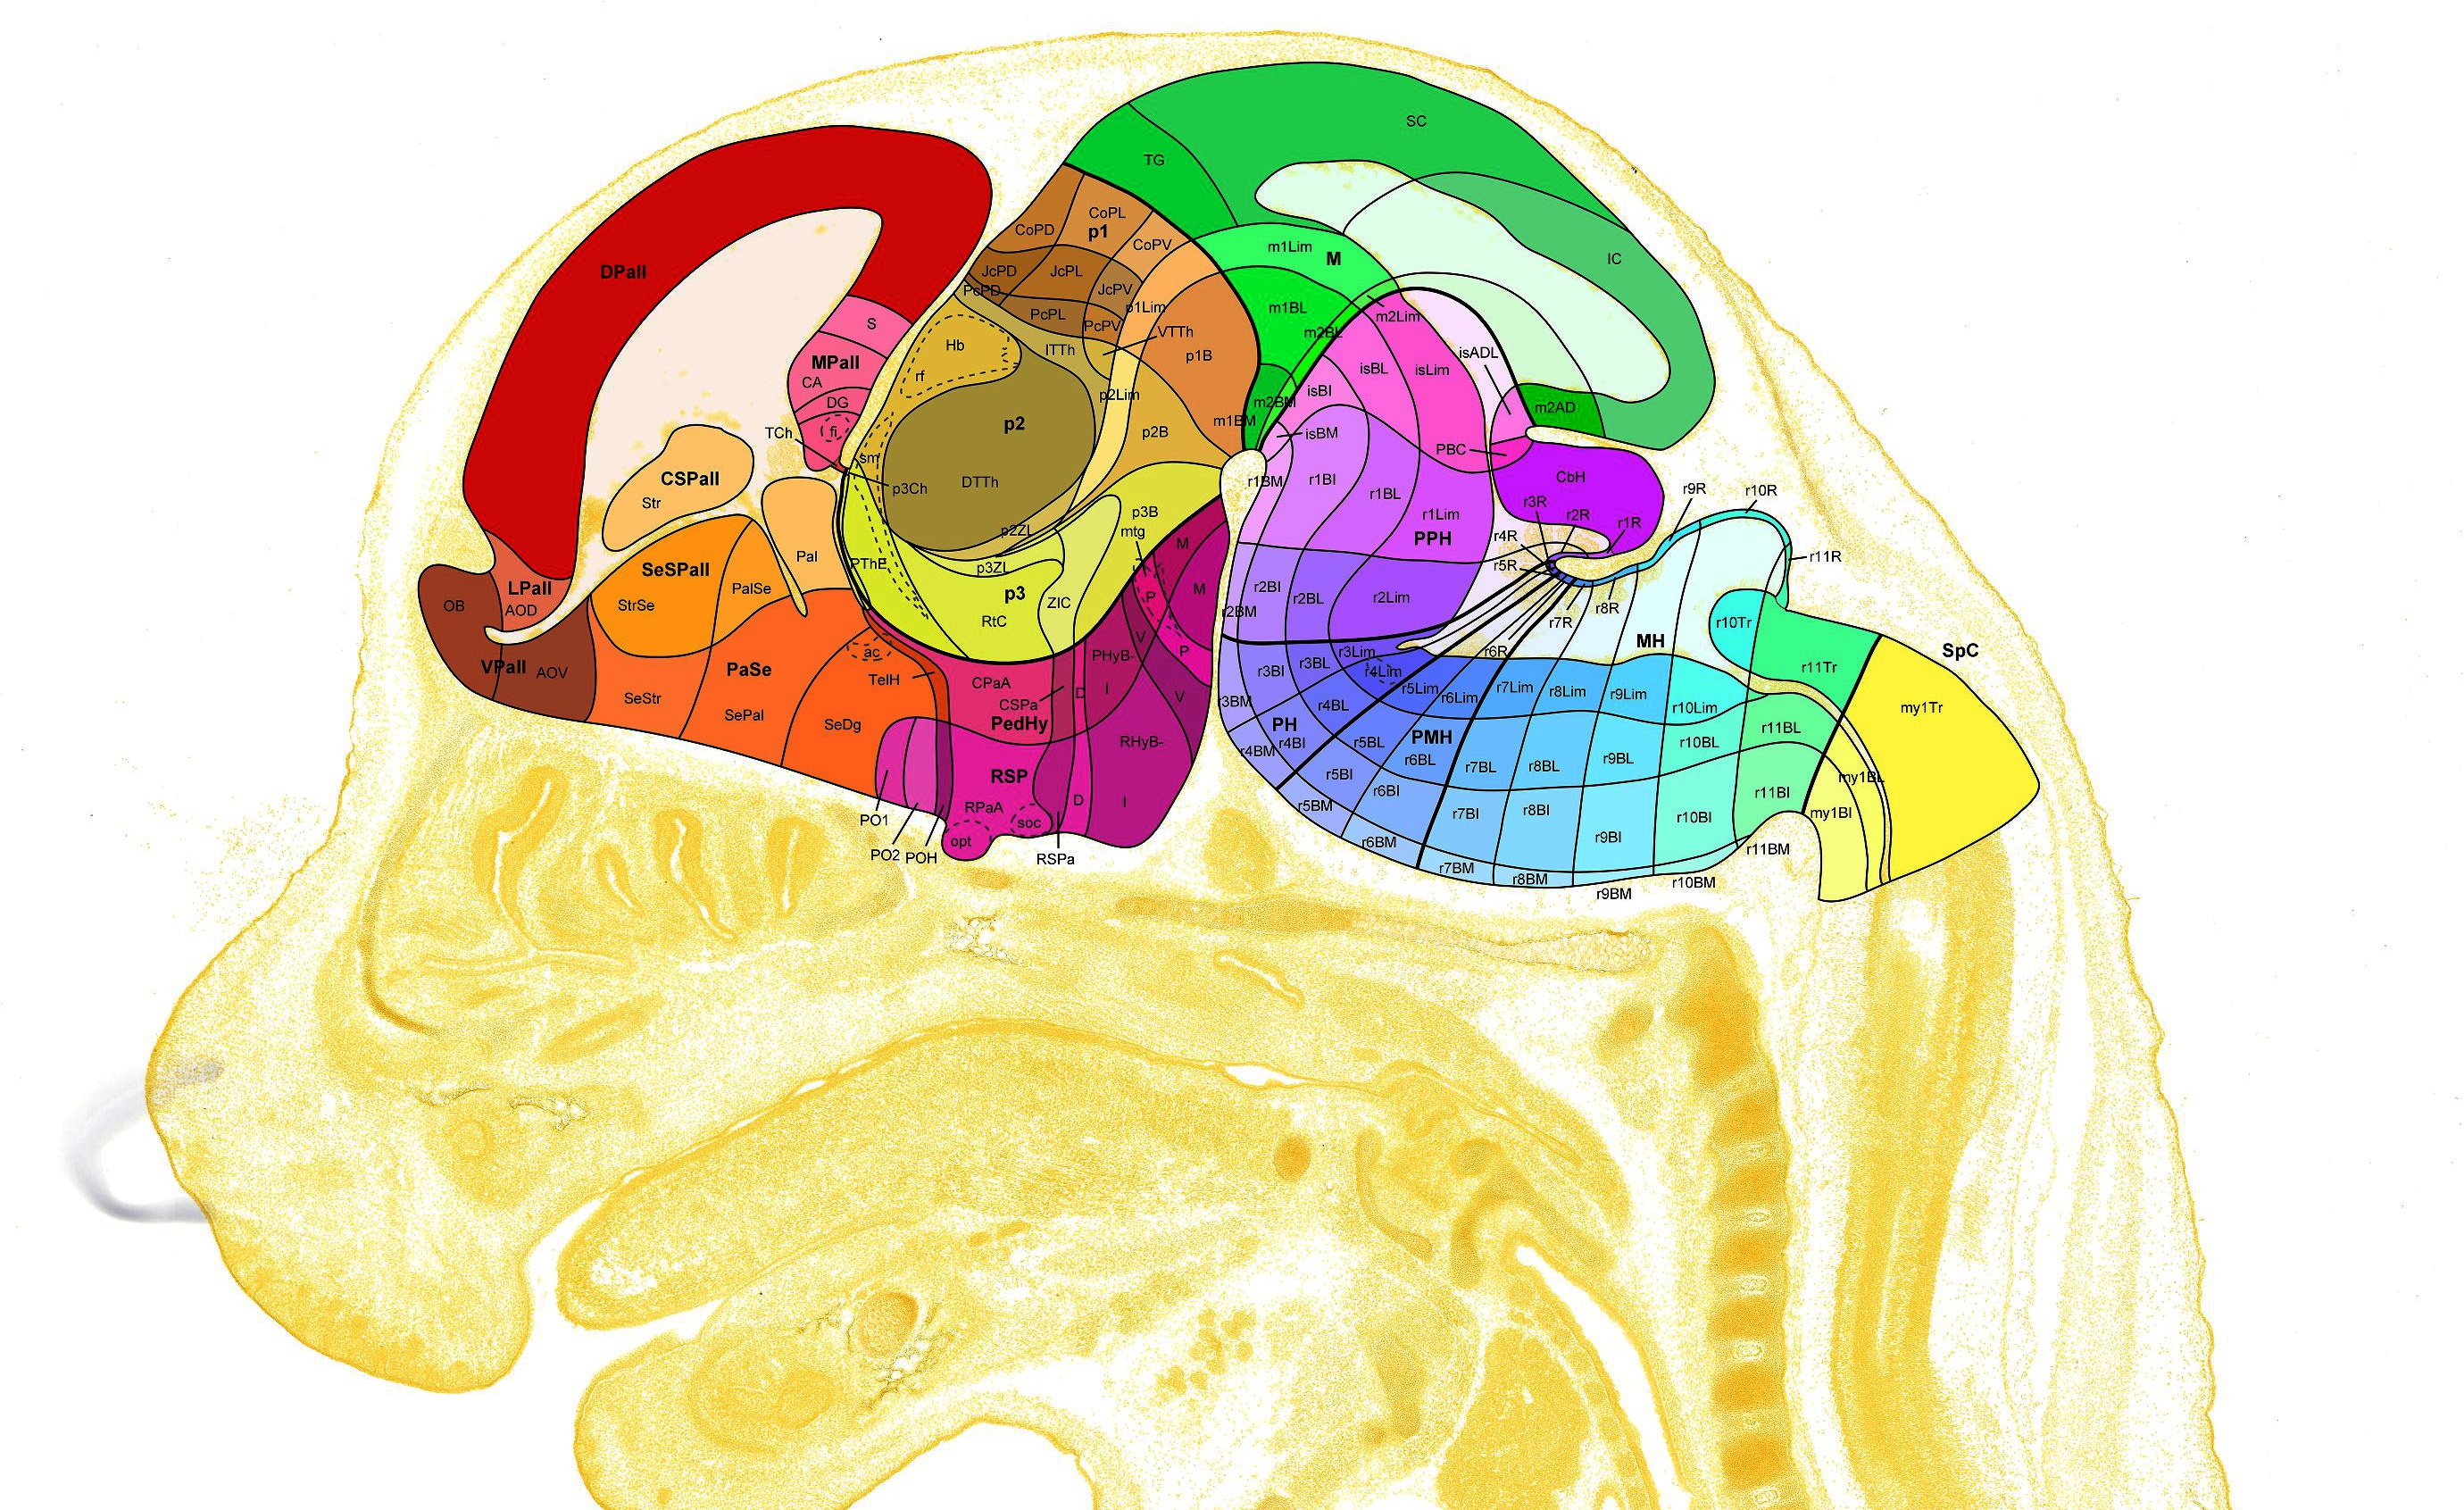
Expression levels of different genes can only be compared to each other when the images have been registered to a common reference space. Because the morphology of the developing mouse brain varies dramatically from stage-to-stage, each stage has its own reference space. To generate a reference space:
- a set of brain sections are custom-labeled to emphasize structural boundaries.
- expert neuroanatomists hand-annotate structural delineations in these sections.
- section images are co-registered and stacked into a 3D volume.
- the registration transforms are re-applied to the structure annotations, resulting in a 3D annotation volume.
ISH images and expressing cell segmentations are similarly co-registered into a 3D volume, which is then directly aligned with reference volume for that specimen's developmental stage. The expression values released in the contest data set are a measure of the sum of expressing pixel intensities within a reference space voxel divided by the total number of pixels in that voxel. This is called expression energy.
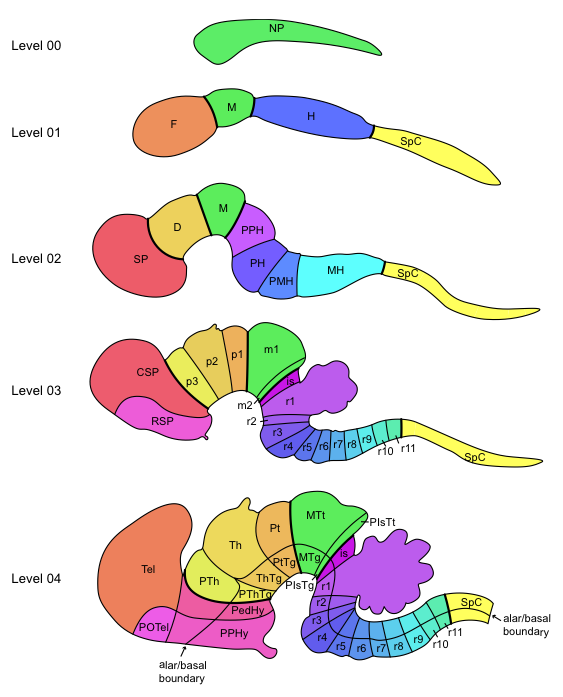
Comparing expression values across developmental stages is a key part of the visualization challenge. Individual voxels cannot be compared across stages, however structure-level statistics can be. One can compare the expression energies between entire stuctures, rather than just a single voxel. This is also non-trivial, however. The ontology of developing mouse brain structures is not only hierarchical, but also time-varying. In the earliest stages of development, the mouse brain has only a few gross structures, which gradually divide into more complex structures over time. These temporal subdivisions are called levels in the data. How do you compare two developmental stages to each other when they don't have the same set of structures? This is one area we hope that you will help.
To summarize, the data set consists of:
- ~12,000 expression energy volumes (6 stages x ~2000 genes)
- structure-level expression energy values for all genes
- a hierarchical, time-varying structure ontology
- 6 volumes of structure annotation ids, one for each stage
- 6 reference atlas volumes, one for each stage
- 11 gene categories, associated with various genes
Expression energy volumes, reference atlas volumes, and annotation volumes are stored as Meta Images (.mhd), which is readily readable by VTK, ITK, and applications like ParaView which are built atop these toolkits. Note that the reference atlas volumes have much larger dimensions than the energy and annotation volumes. Taking into account the physical spacing between voxels, however, all of the volumes have the same (physical) size. Spacing values listed in the Meta Image headers are all in micrometers.
Some voxels in the expression energy volumes have a value of "-1". This value indicates that there was an error in the ISH processing pipeline and that there is no data in that voxel. A negative value was chosen to distinguish between "zero energy" and "error".
The structure-level expression energy values are stored in a separate CSV file per probe. Each row of the CSV describes the combined expression energy of all voxels within a labeled structure. The number of structures will differ from probe to probe because a) the number of structures varies between stages and b) no data was successfully captured in that structure. A missing structure can only be interpreted as "no data", not "no energy".
If you would like to use the data set outside the scope of this contest, you are agreeing to bound to the Allen Institute's terms of use found here .
Tasks
The Allen Developing Mouse Brain Atlas was developed to help the neuroscience community investigate how gene expression changes throughout the process of development in the mouse brain. The contest will focus on answering the following questions, in decreasing order of importance:
- Gradient Identification: which genes exhibit directional expression patterns? For example, in the cortex, rostral-to-caudal gradients indicate involvement with development, whereas exterior-to-interior gradients are involved with layering. Which categories do these genes belong to?
- Structural Patterns: which genes show strong expression in a small set of structures but little expression elsewhere? How do these patterns change throughout development? Which categories do these genes belong to?
- Structure Consistency: which structures have the most consistent expression patterns over time? Which structures are the least consistent? Which structures most resemble each other? This is particularly interesting if the structures are not neighboring. How do the answers change if you restrict the expression patterns to a single gene category?
- Complementary Patterns: which genes have expression patterns that complement each other within a structure? Are these patterns persistent during development? Which categories do these genes belong to?
Download
Gene expression energy volumes, annotation volumes, and reference volumes are being released as Meta images (.mhd), which are readable by VTK, ITK, and other common software libraries. The ontology, gene meta data, and categories, are stored in simple CSV files. All of this is being graciously hosted on the SDSC cloud. Gene meta data is listed on a probe-by-probe basis, so be aware that there can be multiple probes for a single gene. Visit this link to download the data:
https://cloud.sdsc.edu/v1/AUTH_sciviscontest/2013
Linux users can run this simple wget command:
$ wget -r -nH --no-parent --no-check-certificate https://cloud.sdsc.edu/v1/AUTH_sciviscontest/2013/
UPDATE (July 1) - With the release of the updated data announced in the News section, you'll see that the SDSC cloud link contains a data, data_v2, and data_v3 directory. We recommend that you only download one of these directories, as they are quite large. You could modify your wget command as follows:
$ wget -r -nH --no-parent --no-check-certificate https://cloud.sdsc.edu/v1/AUTH_sciviscontest/2013/data_v3/
Allen Institute API
All data released by the Allen Institute, including the data in this contest, was retrieved using the Institute's public API. The python scripts that download this data set are available on github:
https://github.com/AllenBrainAtlas/visweek-2013-contest
The github source code also contains a helpful script or demonstrating how to read the ontology, how to parse gene meta data, and perform other useful tasks. It is recommended to use this code as a starting point for getting a better understanding of the data set.
Interpreting the Data Set
When you download the data set, you will find a set of directories:
- energy/ a directory full of expression energy Meta images, one for each probe in 6 development stages chosen for this contest.
- meta/ a directory containing meta data on probes (data_sets.csv) and structures (structures.csv).
- atlas/ a directory containing reference atlas volumes, one for each developmental stage.
- annotation/ a directory containing grid annotation volumes, one for each developmental stage. Voxel values are structure ids.
- structure_unionizes/ a directory containing one CSV per probe. Each CSV contains a set of rows describing the expression energy for a probe within an entire structure.
meta/data_sets.csv is the index for all of the volume data sets. Each row is a probe for one developmental stage (reference space), and the columns describe which gene and development stage (reference space) the probe targets. meta/structures.csv lists all of the structures in the ontology as well as their hierarchical relationship. Each structure row has a structure_database_id_path column that describes the lineage of the structure all the way back to the root.
Because all of the gene expression energy volumes are MHDs, you can open them in ParaView. You can open an energy volume and its associated reference atlas volume or annotation volume and they should align. You may notice that energy only covers slightly more than one hemisphere of the brain -- this was intentional. Only one hemisphere was sectioned for ISH treatment.
News and Updates
When this page changes we'll update this section and notify email addresses registered with the change notification widget on the left. There will also be a FAQ in this section as necessary.
-
July 1, 2013 - A new time point
The Allen Institute has reprocessed the developing mouse atlas. It has been packaged for the contest and you can download it with the instructions in the Download section. The big difference is the addition of a P28 time point, which has the same structural annotation ontology as the rest of the time points.
The Institute has also reannoated the P56 time point with a matching ontology, however the P56 imaging modality is different from the other time points and the expression energy values are scaled differently. To keep things simple, I'm leaving out P56. If you're curious and want to know how to download it, contact the mailing list.
Participants should feel no pressure to try out the new data set, although new participants are recommended to use the latest and greatest.
-
April 2, 2013 - Extra unionizes?
Several participants have noticed that there are a large number of files in the structure_unionizes directory that have no corresponding data sets. That is correct, and it is an error.
If you read the note below, you'll remember that we are in the process of re-annotating this data set for release in June. As it turns out, some of that data has already been published, and I inadvertently included it in the unionize directory.
Summary: disregard all unionize files that do not have corresponding data sets in the data_sets directory. Sorry for the confusion!
-
February 26, 2013 - How do you interpret categories?
The gene categories in this data set come from the PANTHER gene database. When you look at the classifications column in data_sets.csv, you'll see a forward-slash-delimited set of classification names. A single data set can be associated with more than one category.
The Allen Institute periodically refreshes the gene categories in its internal database. The gene categories were updated just before version 2 of the data set was released (see comment below), so you'll see a slightly larger number of categories in the new data set (32).
-
January 25, 2013 - Disregard the P56 Time Point
A participant has kindly notified us that there is a problem with the P56 time point. If you look at the ID numbers in the P56 annotation volume (annotation/annotation_10.mhd), you'll see that it has a totally different set of structure IDs than the other time points, and these IDs are not contained in meta/structures.csv. These structure IDs are from a different atlas (the Allen Institute's adult mouse gene expression atlas). The P56 structure IDs cannot be used for the developing mouse contest data.
We appologize for this error, and are working to fix it. For now, we've released a second version of the data set that does not have the P56 time point. If you browse the data set from the SDSC cloud storage link, you'll see it now contains a new directory data_v2, which does not contain the P56 time point. We've updated the download instructions accordingly.
The Allen Institute is planning to release an updated version of the developing mouse atlas in June of this year. The gene expression volumes will remain largely unchanged, however the ontology is being overhauled. This means new structure names, new structure IDs, and new annotation volumes. The P56 time point is being re-annotated to use the same ontology as the other developmental time points.
We would love to see how your visualization technique applies to all 6 refreshed time points! However, we understand that 2 major data set changes is a hassle, so we only ask that your submissions work on one of the released data sets. If you would like to "future-proof" your code, avoid hard-coding file names and structure IDs as much as possible.
Thank you for your patience. Again we appologize for the error.
-
January 9, 2013
VisWeek has been officially renamed to VIS. The page has been updated accordingly.
-
January 2, 2013
Updated the awards list to include magazine article submission. Contact emails are correct now. Updated terms of use in the data description.
Submission
Important dates
- Deadline: 2 September 2013
- Notification: 24 September 2013
- VIS Conference: October 2013
Requirements of the winning team
- Participation at the conference (note, one registration is free)
- A short talk during the plenary session
- A poster of the work for the poster session
Rules
- The contest is open to everyone except contest organizers and judges. Sponsors can participate non-competitive. We invite submissions from individuals or teams, from industry or academia.
- Submissions must be formatted according to the guidelines below, otherwise we reserve the right to disregard it.
Requirements for submissions
To demonstrate your approach, you are expected to submit:
- A 2-page mini-paper in PDF format describing your visualization and analysis techniques.
- Up to 12 additional images (beyond those in the paper) showing how the visualizations help answering the questions. The images should be appended to the 2-page document (thus, your whole pdf document should have more than 2 pages). You are invited to use captions in order to explain your images.
- An MPEG, AVI, or Quicktime video (duration at most 10 minutes) showing the methods or processes in action. This will be most helpful for demonstrating the effectiveness of the proposed methods. You have the opportunity to submit 2 videos: one high-quality video for the review process and one compressed video (up to 50 MB) for the electronic proceedings of the IEEE VIS 2013.
- Visit http://www.cs.sfu.ca/~vis/Tasks/camera.html for a summary of the formatting guidelines of the manuscript.
- You may make your paper and video anonymous. However, in that case we will not make it publicly available. Otherwise, your submission will be published on our webpage and in the electronic proceedings of the IEEE VIS 2013
- We reserve the right to exclude submissions that are of bad quality, that are not useful in any part, or that do not adhere to the guidelines and requirements set forth here.
- The 2-page write-up should not try to give any background information, which will probably be the same for each contestant anyway. Instead, we would like to learn the important information on what novel visualization ideas you have come up with, how the visualizations were created, what insights scientists might be able to gain from your visualizations, etc.
- We will not be running any software as part of the evaluations. Instead, your paper, images, and videos should convey everything we should know about your work.
Submission procedure
- The PDF document and the video should be compressed as one single ZIP archive. No password, please! Please use the following naming convention: university name, initials of first two authors. Example: if your university name is "Clausthal", and the first two authors have the initials GZ and JF, then the file name should be clausthal_gz_jk.zip.
- The ZIP archive file has to be uploaded via anonymous FTP at the following server: ftp://ftp.sdsc.edu/incoming/viscontest
- Once you have submitted your entry, send us an email (see Contact page) and we will confirm your submission.
- Please note that only committee members can view the submissions at the FTP server!
Awards
The winning team will receive:
- Opportunity to submit a full length manuscript via fast track review to a reputable magazine.
- One free full registration for the VIS 2013 conference.
- A 10 minute slot during the award ceremony in the plenary session.
- Award certificate for each member of the winning team.
- Opportunity to present the work at the poster session.
Runner-ups
Depending on the number of submissions and the reviews, honorable mentions will be awarded. The honorable-mention teams will receive award certificates for each team member.
Publications
All submissions will be published in the electronic proceedings of the IEEE VIS 2013. We reserve the right to exclude submissions which are of bad quality and which are not useful in any part.
Contact
You can always contact the chairs at this email address: scivis_contest ieeevis org. Questions appropriate for all contest participants can go here: scivis_contest_participants ieeevis org. If you would like to join the participants mailing list, just email one of the two mailing lists.
If you have any questions about the data, submission procedure, or anything else, please do not hesitate to contact us.
Chair: Gabriel Zachmann, University of Bremen, Germany
Co-Chair: David Feng, Allen Institute for Brain Science. davidf alleninstitute org
Acknowledgements
Web and data hosting is provided by courtesy of SDSC. Thanks a lot to Amit Chourasia and Jan Klein, SciVis Contest Advisors, for their continuous support.